Deep Dive into Oceanographic Data


Abstract
We worked with a leading ocean intelligence company to develop a near real-time data ingestion and visualization platform for providing valuable insights over changing oceanography conditions. These insights are valuable to commercial fisheries, as well as agriculturists as it provides them with predictive analysis related to various species and changing ocean conditions.
About Our Client
Our client is a leading space technology and intelligence company, delivering services in Space Infrastructure and Earth Intelligence. We are working with them in the Ocean Intelligence space to help commercial fisheries optimize operations, monitor changing ocean conditions and protect aquaculture assets with near-real time data. The product suite is extendable to on-ground operations to help small and large agricultural farmers with prediction and communications capabilities.

Solution Details
-
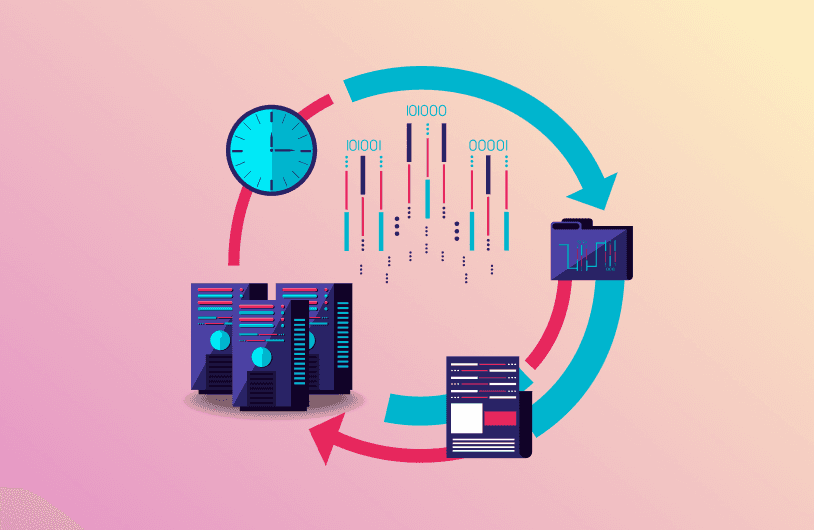
Data Ingestion
A data ingestion module is developed to fetch data from Satellite data feed. The data is stored as NetCDF and ESRI Shape files with segregation for date, region and products. Developed in Python as a daily cron job.
-
ETL pipeline
An ETL pipeline is developed to read product files and transform it to create vector data – Shape files, GeoJSON layers and raster data – GeoTIFF layers.
-
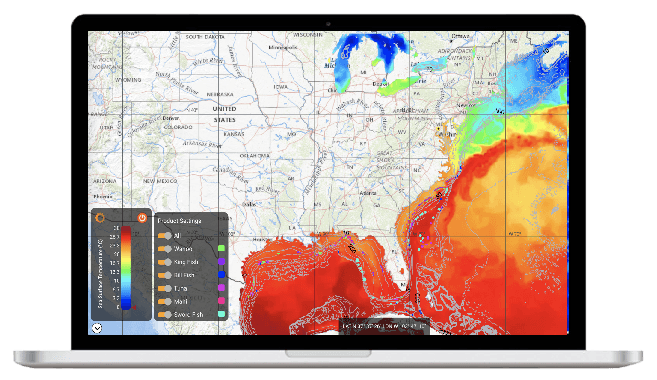
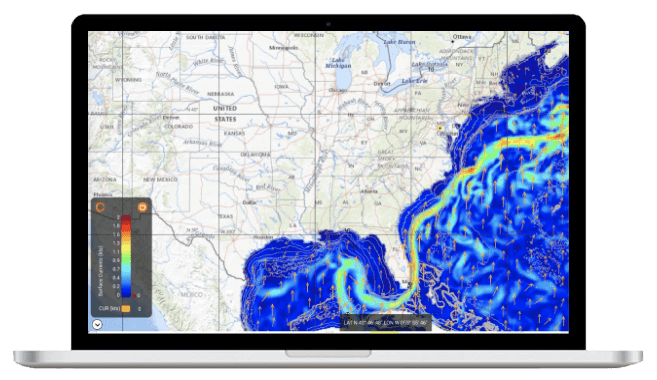
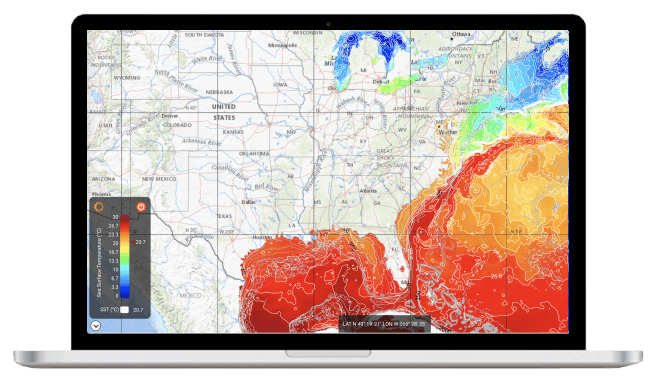
Visualization
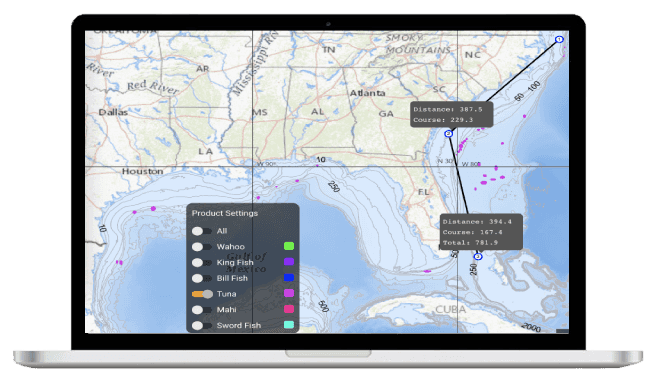
A Powerful UI is developed, allowing users to manipulate, filter and sort the data for further analysis. MapBox GL JS is used to render geo-referenced images, contour lines and marker clusters.
Technology Used


Near real-time data for fishing recommendations and ocean conditions helped the fishermen to locate the closest, most productive fishing grounds.
Various oceanographic data values like temperature, plankton helped researchers with the understanding of climate changes as well as effects of chemical contamination and its impact on marine life.
Feature based thin client deployment made it easy to reach a larger and wider customer base.
Conclusion
Developing a near real-time oceanographic data ingestion and visualization platform presents unique challenges, but with adequate research about the domain and experimenting with the technologies available, we were able to achieve our desired solutions. A map driven solution can further be extended for weather prediction, monitoring vessels in the ocean and for performing predictive fishing analysis.


What Our Customers Say
Real experiences, real impact. See how we've helped customers thrive with tailored services.


Tech Prescient was very easy to work with and was always proactive in their response.
The team was technically capable, well rounded, nimble and agile. They could interpret, adopt and implement the required changes quickly.

MURALI RAMSUNDER
SENIOR ARCHITECT, VONAGE.COM


Amit and his team at Tech Prescient have been a fantastic partner to Measured.
We have been working with Tech Prescient for over three years now and they have aligned to our in-house India development efforts in a complementary way to accelerate our product road map.

TREVOR TESTWUIDE
CO-FOUNDER & CEO, MEASURED INC.

We were lucky to have Amit and his team at Tech Prescient build CeeTOC platform from grounds-up.
Having worked with several other services companies in the past, the difference was stark and evident.

ALOK SRIVASTAVA, PHD
FOUNDER AND CEO, CEETOC INC.

We have been extremely fortunate to work closely with Amit and his team at Tech Prescient.
The team will do whatever it takes to get the job done and still deliver a solid product with utmost attention to details.

SREENIVASA GORTI, PHD
CTO / CO-FOUNDER, INNOSTREAMS INC.
Customer success stories